
- Major US stock indexes slid 1% due to a volatile combination of escalating geopolitical instability in the Middle East and mounting jitters within the $2 trillion private credit market.
- Crude oil prices surged toward $100 per barrel after tanker attacks in Iraqi waters and Iranian threats to keep the Strait of Hormuz closed.
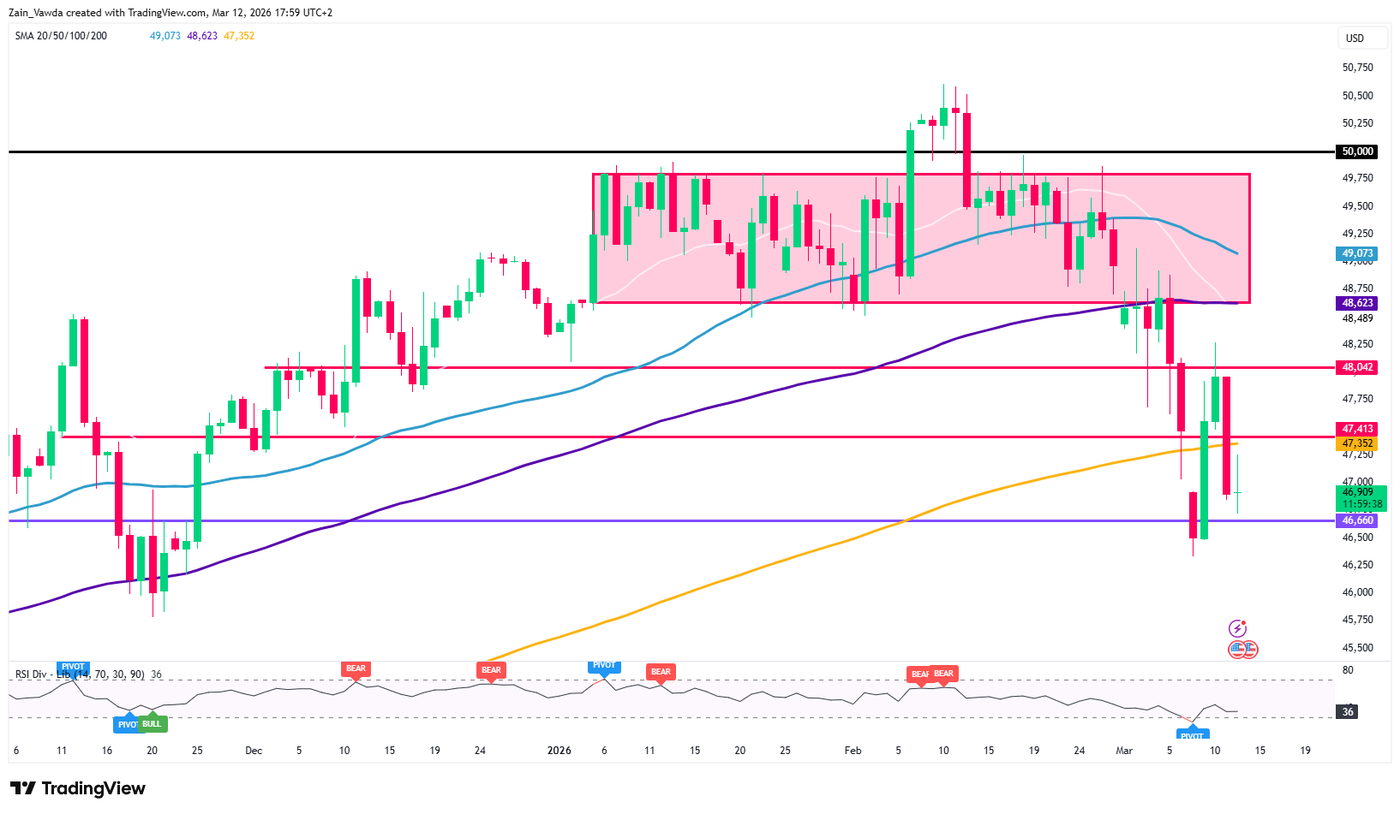
- The Dow Jones index has fallen below its 20, 50, and 100-day Simple Moving Averages (SMAs), with the 20-day and 50-day SMAs sloping downward, signaling a firmly bearish short-to-medium-term trend.
- 46660 support may be key to a short-term bounce.
Most Read: Bitcoin’s (BTC/USD) Price Outlook: Why Bitcoin’s recovery still lacks the ingredients for a decisive bullish turn
Major US stock indexes slid 1% on Thursday as a volatile mix of geopolitical instability and domestic credit concerns shook investor confidence.
The primary catalyst was a sharp spike in crude oil prices, which surged toward the $100-per-barrel threshold following reports of two tankers set ablaze in Iraqi waters. These incidents, attributed to apparent Iranian strikes, are part of a broader wave of attacks targeting energy and transport infrastructure across the Middle East.
The escalation was further underscored by a defiant stance from Iranian Supreme Leader Mojtaba Khamenei, who suggested that the Strait of Hormuz, a critical global energy artery should remain closed as a strategic lever of pressure.
This supply-side threat has effectively reignited fears of persistent inflation, hitting the financial sector particularly hard as traders brace for a potentially more aggressive economic environment.
Comments late last night by Iranian military officials about potential attacks on companies in the Gulf which support the US military may also be weighing on markets in early trade.
Compounding these worries, Wall Street is also closely monitoring mounting “jitters” within the private credit market, adding another layer of risk to an already fragile trading session.
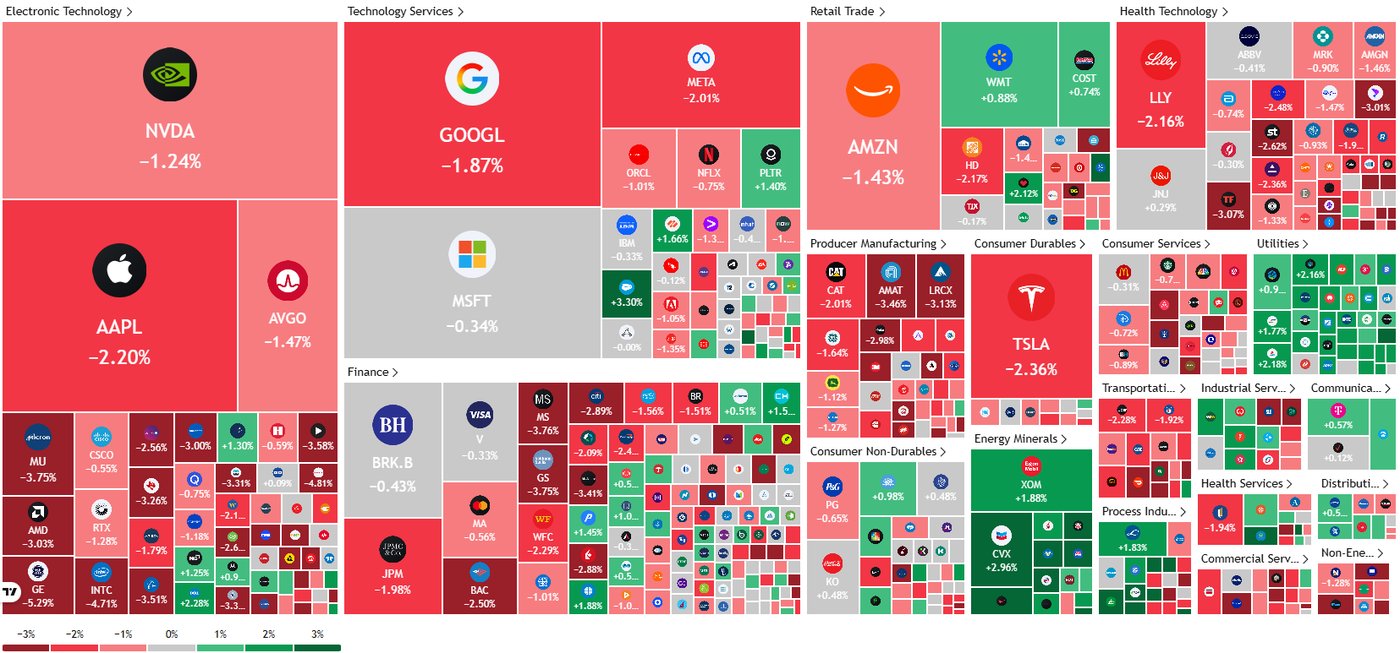
S&P 500 Heatmap
Private credit fears on the rise
The $2 trillion private credit market is facing intense scrutiny as a series of recent defaults has sparked widespread concern among investors. This anxiety was amplified by a warning from the Swiss private equity firm Partners Group, which projected that default rates in the sector could potentially double over the next few years.
These mounting jitters triggered a significant sell-off in the financial sector, with the S&P 500 financials index dropping 1.5%.
The impact was felt acutely among major institutional players, particularly after Morgan Stanley saw its shares tumble 4.3% following a decision to limit redemptions at one of its private credit funds.
This move follows similar restrictive actions taken by Blackstone and BlackRock earlier this month, both of which saw their stock prices decline by more than 1%. Further rattling the market, JPMorgan Chase moved to reduce the valuations of certain loans tied to private credit funds, contributing to broader losses for banking giants like Citigroup and Goldman Sachs, which both fell by more than 3%.
Oil reserves release only a temporary fix
The International Energy Agency said that the world is facing the biggest oil supply disruption ever. This comes as the IEA announced a coordinated emergency release of up to 400m barrels.
It’s a record amount, eclipsing the 182m barrel emergency release from 2022. We’re still waiting for the IEA to provide full details of the release.
There are still concerns regarding the IEA-coordinated release, especially about the speed at which this oil will reach the market and whether it will be enough to tie up the market until we see oil flowing through the Strait of Hormuz again.
US Energy Secretary Wright speaking late on Wednesday said that the US will release 172 million barrels of oil from the Strategic Petroleum Reserve. It will take about 120 days to deliver the fuel.
According to ING research, this works out to a US release of around 1.4m b/d. If you assume a similar timeline for other countries, that works out to 3.3m b/d- far short of the supply losses we are seeing from the Persian Gulf.
Either way, these releases are not a long-term fix and the longer the Strait of Hormuz remains closed the probability of higher oil prices and supply shortfalls increase.
Wall Street outlook moving forward
Risk assets are likely to remain under pressure the longer the conflict drags on. The economic outlook has shifted with concerns growing around supply of various products from fertilizers to helium etc.
This is reflected by Goldman Sachs cutting their US economic outlook and raising their Oil forecast for the second time in little over a week.
According to standardized economic models, a sustained 10% increase in oil prices typically adds 0.2 percentage points to the headline inflation rate and 0.04 points to core inflation. This same 10% surge generally drags down GDP growth by a tenth of a percentage point, though the severity of this slowdown can be mitigated by the productivity of domestic energy producers.
Beyond energy costs, the economy is also grappling with the restrictive weight of tighter financial conditions. Research indicates that for every 1 percentage point of tightening in the financial conditions index, GDP growth is reduced by a full point over the subsequent year. Currently, Goldman Sachs’ financial conditions index has already tightened by 0.2 percentage points, signaling a measurable cooling effect on the broader economy.
Technical Analysis – Dow Jones
From a technical perspective, the Dow Jones recovered admirably after the weekend gap down which saw the index open some 500 points lower than Fridays close.
The entire gap was closed on monday followed by another day of gains on Tuesday but risk sentiment has since waned as markets begin to expect a drawn out conflict in the Middle East.
This led to yesterdays significant selloff which saw the Dow shed around 1000 points and print a massive bearish engulfing candle.
The price has fallen below its 20, 50, and 100-day Simple Moving Averages (SMAs). Notably, the 20-day SMA (light blue) and 50-day SMA (purple) are beginning to slope downward, signaling that the short-to-medium-term trend is firmly bearish.
However, the index is holding above a key support area for now at the 46660 handle with a daily close above this handle opening up a possible short-term bounce.
At this stage though, the technicals may be at the mercy of the fundamental factors driving markets and need to be put in perspective.
Any significant developments on the geopolitical front could lead to a drastic change of the technical outlook as well.
Dow Jones Daily Chart, March 12, 2026
Follow Zain on Twitter/X for Additional Market News and Insights @zvawda
Opinions are the authors’; not necessarily that of OANDA Business Information & Services, Inc. or any of its affiliates, subsidiaries, officers or directors. The provided publication is for informational and educational purposes only.
If you would like to reproduce or redistribute any of the content found on MarketPulse, an award winning forex, commodities and global indices analysis and news site service produced by OANDA Business Information & Services, Inc., please refer to the MarketPulse Terms of Use.
Visit https://www.marketpulse.com/ to find out more about the beat of the global markets.
© 2026 OANDA Business Information & Services Inc.
#Dow #Jones #tumbles #points #Strait #Hormuz #tensions #private #credit #jitters #support #key