
- Canadian Employment data saw the Unemployment Rate tick lower, but elevated wage growth could put the Bank of Canada back into action
- While the US-Iran ceasefire eased WTI prices, Canadian Crude becomes a viable alternative, helping prospects for the Loonie
- In-depth Technical Analysis and technical levels for USD/CAD and EUR/CAD
Canadian Employment data just released, coming very close to expectations (14.1K vs 15K exp), marking another chapter of sideways economic trajectory for the Land of Maple Syrup.
The headline number itself is welcome for Canada, but its details still cast doubt on the BoC. Last month showed a large decrease in labor data, and these numbers, while trading higher, haven’t shown any sign of consistency – At least, the Unemployment rate ticked lower to 6.7% (from 6.8%).
The one stark detail that could get the Bank of Canada to turn more hawkish, without counting war-led energy price rises, is that wages are up 4.7% y/y, which could play a huge role in future inflation spikes, for now still hanging close to the 2% target.

Similar to what was seen in today’s US CPI release, a 0.9% rise would likely scare the Central Bank into rate hikes, for now still priced at only 30 bps for the year.
A lot of conditionality for now, but the BoC did mention that future policy could head both ways as details from the war progressively arise.
A positive development for the CAD.
Also, Markets received the shocking news of a (feeble) US-Iran ceasefire, which immediately took out a 15% premium in WTI prices. As a major Oil producer and exporter, the CAD eased in response, but the uncertainty regarding the situation in the Strait of Hormuz should preserve Canada’s relative advantage in the field.
The world is now turning its attention to the negotiation table, waiting for further clarity. For now, Hormuz is still in dire straits (pun intended) as Iran makes use of its leverage on the world’s most important 10km region.
So while lower WTI prices and a better geopolitical outlook ease some of the War Premium seen in the CAD, the fact that it remains a consistent producer and economic partner lifts the Loonie’s prospects in the medium term.
After all, demand for Canadian Crude is rising again, and even at $70/bbl, this is still a ~30% increase from early 2026 levels for Black Gold.
Except for any major crisis in the Canadian Economy, odds for the Canadian Dollar to return to 2025 lows are close to specks of dust.
Enough talk, let’s dive right into a two-timeframe USD/CAD analysis and a quick look into EUR/CAD, the second-most-traded Canadian Dollar FX pair.
Read More:
- Breaking News: US inflation surges to 2-year high of 3.3%, Dollar Index (DXY) slips as US-Iran talks in focus
- NBP expands gold reserves and moves closer to the global Top 10
- Has Crypto heard enough for a rally? Bitcoin (BTC) & Ethereum (ETH) Outlook
USD/CAD Daily and Intraday Technical Analysis
USD/CAD Daily Chart
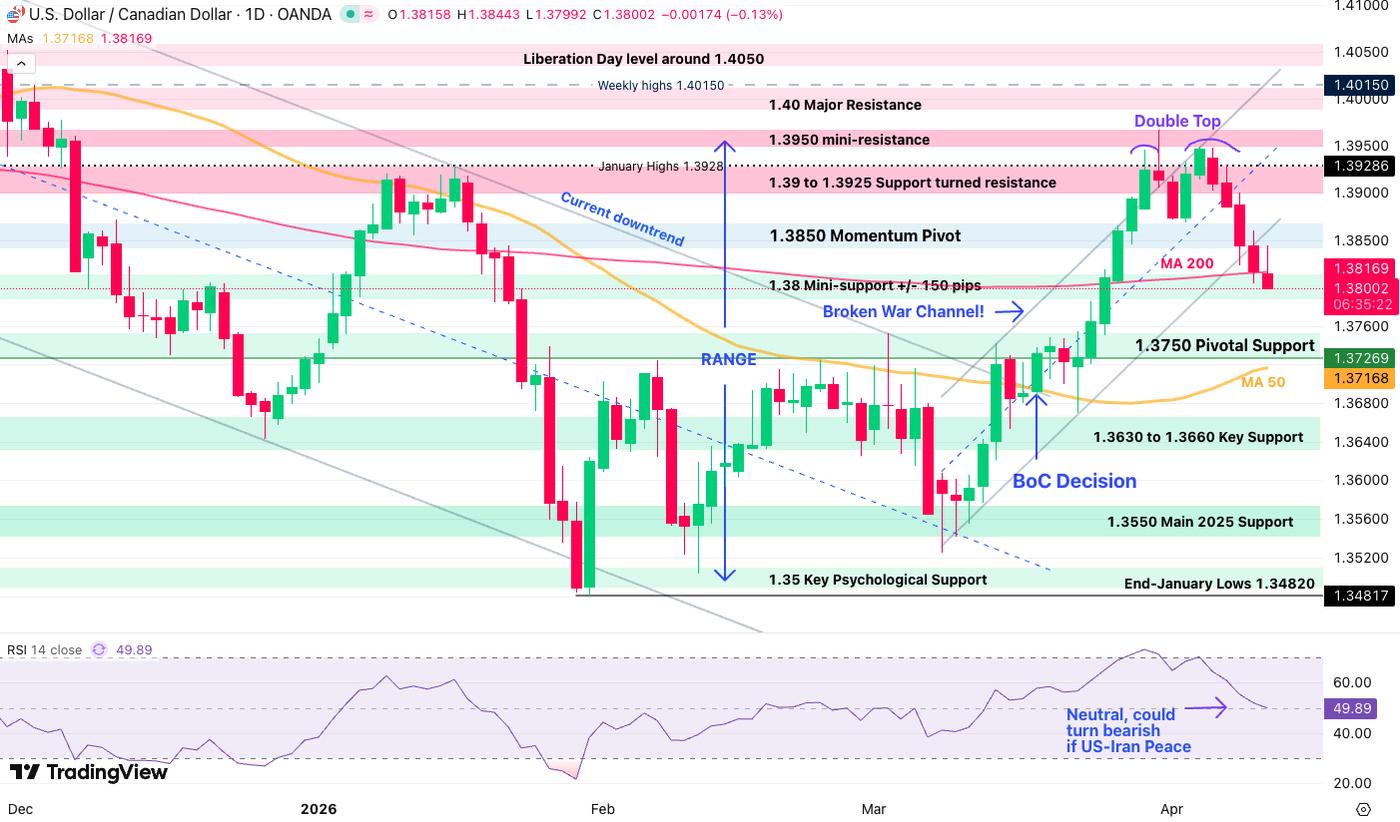
After a massive rally in the North-American FX pair, a double top did what it does best and preceded a strong 2,000 pip retracement, officially breaking the War bull channel.
Looking at the big picture, USD/CAD is responding well to its 1.3550 – 1.3950 Range.
While breaching the 200-Day Moving Average, bears may face a short-term challenge with conflicting War signals (the USD dominates if the war prolongs) and this comes particularly important around the 1.38 Support level.
With Daily RSI coming right at the neutral level, the coming days will be essential for further technical developments (bearish below 50, bullish above).
Let’s take a closer look to spot key areas of interest.
USD/CAD 1H Chart and Trading Levels

USD/CAD is forming the premises of a proper downward channel, now testing the 1.38 Support, acting as final barrier to a consistently bearish price action in the pair.
While immediate momentum is bearish (large responses to the 50-Hour MA – 1.3835), oversold RSI conditions and geopolitical uncertainty might keep the action muted for the weekend.
- Any retracement here could look to retest the 50H MA
- A larger US Dollar rebound may retest the 1.3860 channel break (Optimal entry points if it reaches there)
- Breaking 1.38 on the daily would take it to the lower bound of its large range, so further downside in this scenario
Levels to place on your USD/CAD charts:
Resistance Levels:
- 50-Hour MA – 1.3835
- 1.3850 – 1.3870 Momentum Pivot (Channel retest 1.3860)
- 1.39 to 1.3925 Support turned resistance
- 1.3950 mini-resistance (Range Highs)
- 1.40 Major Resistance
Support Levels:
- 1.38 Mini-support +/- 150 pips (testing)
- 1.3750 Support
- 1.3630 to 1.3660 Key Support
- 1.3550 Main 2025 Support (Range Lows)
EUR/CAD Daily Chart

EUR/CAD went onto its own roller coaster adventure last month, with a 5,000 pip down-and-up swing!
Currently testing the 1.62 level, rejecting here would be necessary for bears to retake control in the FX Minor, particularly as this would stall the end-March tight bull channel.
- Breaking back above 1.62 on the daily marks a return within the 1.61 to 1.64 larger range (lower odds)
- Rejecting 1.62 would mark an optimal entry for longer-term EUR/CAD bears
- Falling below 1.6150 on the weekly would confirm more downside ahead.
Levels to place on your EUR/CAD charts:
Resistance Levels:
- 1.62 Key Resistance (rejecting)
- July 2009 Highs around 1.6350
- Late 2025 range highs 1.64
- August 2025 Highs 1.64697
Support Levels:
- 1.6150 Pivot
- 1.60 -1.6050 Major Support
- Pivotal Support (Long-term bearish below) 1.5950
- July Low Key Support around 1.58
- War Lows Key Support 1.56 (+/- 150 pips)
Safe Trades!
Follow Elior on Twitter/X for Additional Market News, interactions and Insights @EliorManier
Opinions are the authors’; not necessarily that of OANDA Business Information & Services, Inc. or any of its affiliates, subsidiaries, officers or directors. The provided publication is for informational and educational purposes only.
If you would like to reproduce or redistribute any of the content found on MarketPulse, an award winning forex, commodities and global indices analysis and news site service produced by OANDA Business Information & Services, Inc., please refer to the MarketPulse Terms of Use.
Visit https://www.marketpulse.com/ to find out more about the beat of the global markets.
© 2026 OANDA Business Information & Services Inc.
#USDCAD #forms #gigantic #range #Employment #Oil #prices #endanger #CAD