
- The overall bias for USD/CHF has turned decidedly bearish in the short to medium term following a significant rejection at the 0.80000 psychological handle.
- The pair is currently testing a critical support level at 0.78285, which is described as the “line in the sand” for bulls.
- Lower timeframes show extreme oversold readings on the RSI, hinting at a possible short-term corrective bounce toward resistance around 0.79000 before a potential continuation of the downside.
Daily Timeframe: Structural Shift at Key Resistance
On the Daily chart, USD/CHF has faced a significant rejection at the 0.80000 psychological handle. This level has proven to be a formidable barrier, leading to a sharp reversal that has now brought the pair back down to a critical inflection point.
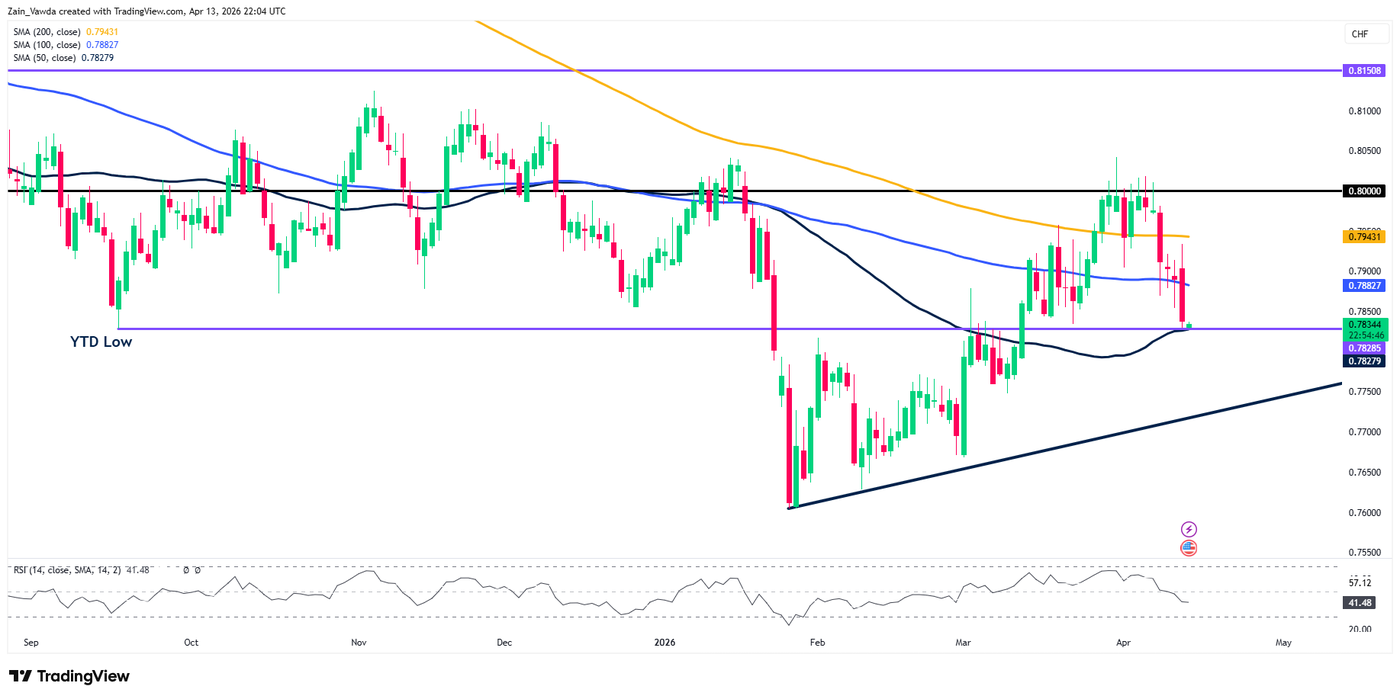
Trend Dynamics: The pair has been trending higher since early 2026, supported by an ascending trendline (dark navy). However, the recent price action shows a decisive break below the 200-day MA (yellow) and the 100-day MA (blue), signaling a shift in medium-term momentum.
Key Support/Resistance: We are currently testing the 0.78285 – 0.78344 support zone. This area aligns with previous structural pivots and is bolstered by the 200-day MA (black) sitting just above at 0.78279.
Indicator Outlook: The RSI is trending lower but has not yet reached oversold territory, suggesting there may be further room for the downside if the current support level fails to hold on a daily candle closing basis.
USD/CHF Daily Chart, April 13, 2026
H4 Timeframe: Momentum Accelerating Downward
The H4 chart provides a clearer view of the recent “waterfall” sell-off. The bearish momentum accelerated once the pair lost the confluence of the moving averages near the 0.79400 region.
Moving Averages: The 50, 100, and 200 MAs are now fanning out above the current price, acting as dynamic resistance. The Death Cross (50 MA crossing below the 100/200 MA) is about to take place as well.
Price Action: We see a series of Lower Highs and Lower Lows. The current candle is hovering right at the 0.78285 horizontal support. A sustained break here would likely target the ascending trendline from the daily chart, currently located around the 0.77200 area.
RSI: On this timeframe, the RSI is deep in oversold territory (~30.99), which could hint at a short-term corrective bounce or consolidation before the next leg lower.
USD/CHF Four-Hour Chart, April 13, 2026

H1 Timeframe: Intraday Exhaustion?
The hourly chart highlights the sheer velocity of the move during the April 13th session. The pair dropped nearly 100 pips in a straight line without a significant retracement.
Current State: The price is “hugging” the bottom of the range at 0.78345. Note the RSI on the H1 is at 26.76, indicating extreme intraday exhaustion.
Tactical Levels: * Immediate Resistance: If we see a “mean reversion” play, the first hurdle is the 0.78932 (50 MA) followed by the 0.79000 level.
Support: The 0.78285 level remains the “line in the sand” for bulls on an intraday and larger timeframe basis..
USD/CHF One-Hour Chart, April 13, 2026

Comprehensive Outlook
The overall bias for USD/CHF has turned decidedly bearish in the short to medium term following the failure at 0.80000.
Bullish Scenario: For the bulls to regain control, we need to see a strong rejection at the current 0.78285 support, followed by a daily close back above the cluster of moving averages at 0.79400.
Bearish Scenario: If the pair fails to hold 0.78285, the path of least resistance points toward the long-term ascending trendline near 0.77500 – 0.77200. Given the oversold RSI readings on the lower timeframes, a minor retracement to retest broken support (now resistance) at 0.79000 would offer a higher-probability entry for trend followers.
Key takeaway: Keep a close eye on the 0.78285 level; a daily candle close below this mark could trigger a fresh wave of selling toward the YTD lows.
Follow Zain on Twitter/X for Additional Market News and Insights @zvawda
Opinions are the authors’; not necessarily that of OANDA Business Information & Services, Inc. or any of its affiliates, subsidiaries, officers or directors. The provided publication is for informational and educational purposes only.
If you would like to reproduce or redistribute any of the content found on MarketPulse, an award winning forex, commodities and global indices analysis and news site service produced by OANDA Business Information & Services, Inc., please refer to the MarketPulse Terms of Use.
Visit https://www.marketpulse.com/ to find out more about the beat of the global markets.
© 2026 OANDA Business Information & Services Inc.
#Critical #Crossroads #USDCHF #tests #key #support #bounce