
By Valiantsin Kuzmenka
Introduction
In over a decade of directing commercial expansions across Eastern Europe, the Gulf Cooperation Council, and North America, I observed one recurring pattern: sales teams that underperformed in a new market were rarely running the wrong product or the wrong price. They were running the wrong cultural operating model — a methodology shaped by one market’s decision logic, applied without adjustment to another’s.
Analyzing bilateral trade flows through gravity model data, Pankaj Ghemawat demonstrated that companies systematically overestimate foreign market attractiveness by underweighting cultural, administrative, geographic, and economic distance — the CAGE framework (Ghemawat, 2001). His analysis showed that countries sharing a common language trade roughly three times more than linguistically distant counterparts, confirming that cultural proximity carries direct, quantifiable commercial consequences.
The downstream cost of misregarding this variable is documented. Across cross-border M&A transactions, 70–90% fail to deliver expected shareholder value, with cultural incompatibility consistently identified as a primary cause (Christensen, Alton, Rising & Waldeck, 2011). This same friction operates earlier and more quietly in organic market entry: inside the sales cycle, the forecasting model, and the first commercial conversation.
This article treats cultural literacy as a structural commercial variable: diagnosable before market entry and directly addressable through pre-entry methodology design.
Theoretical Grounding
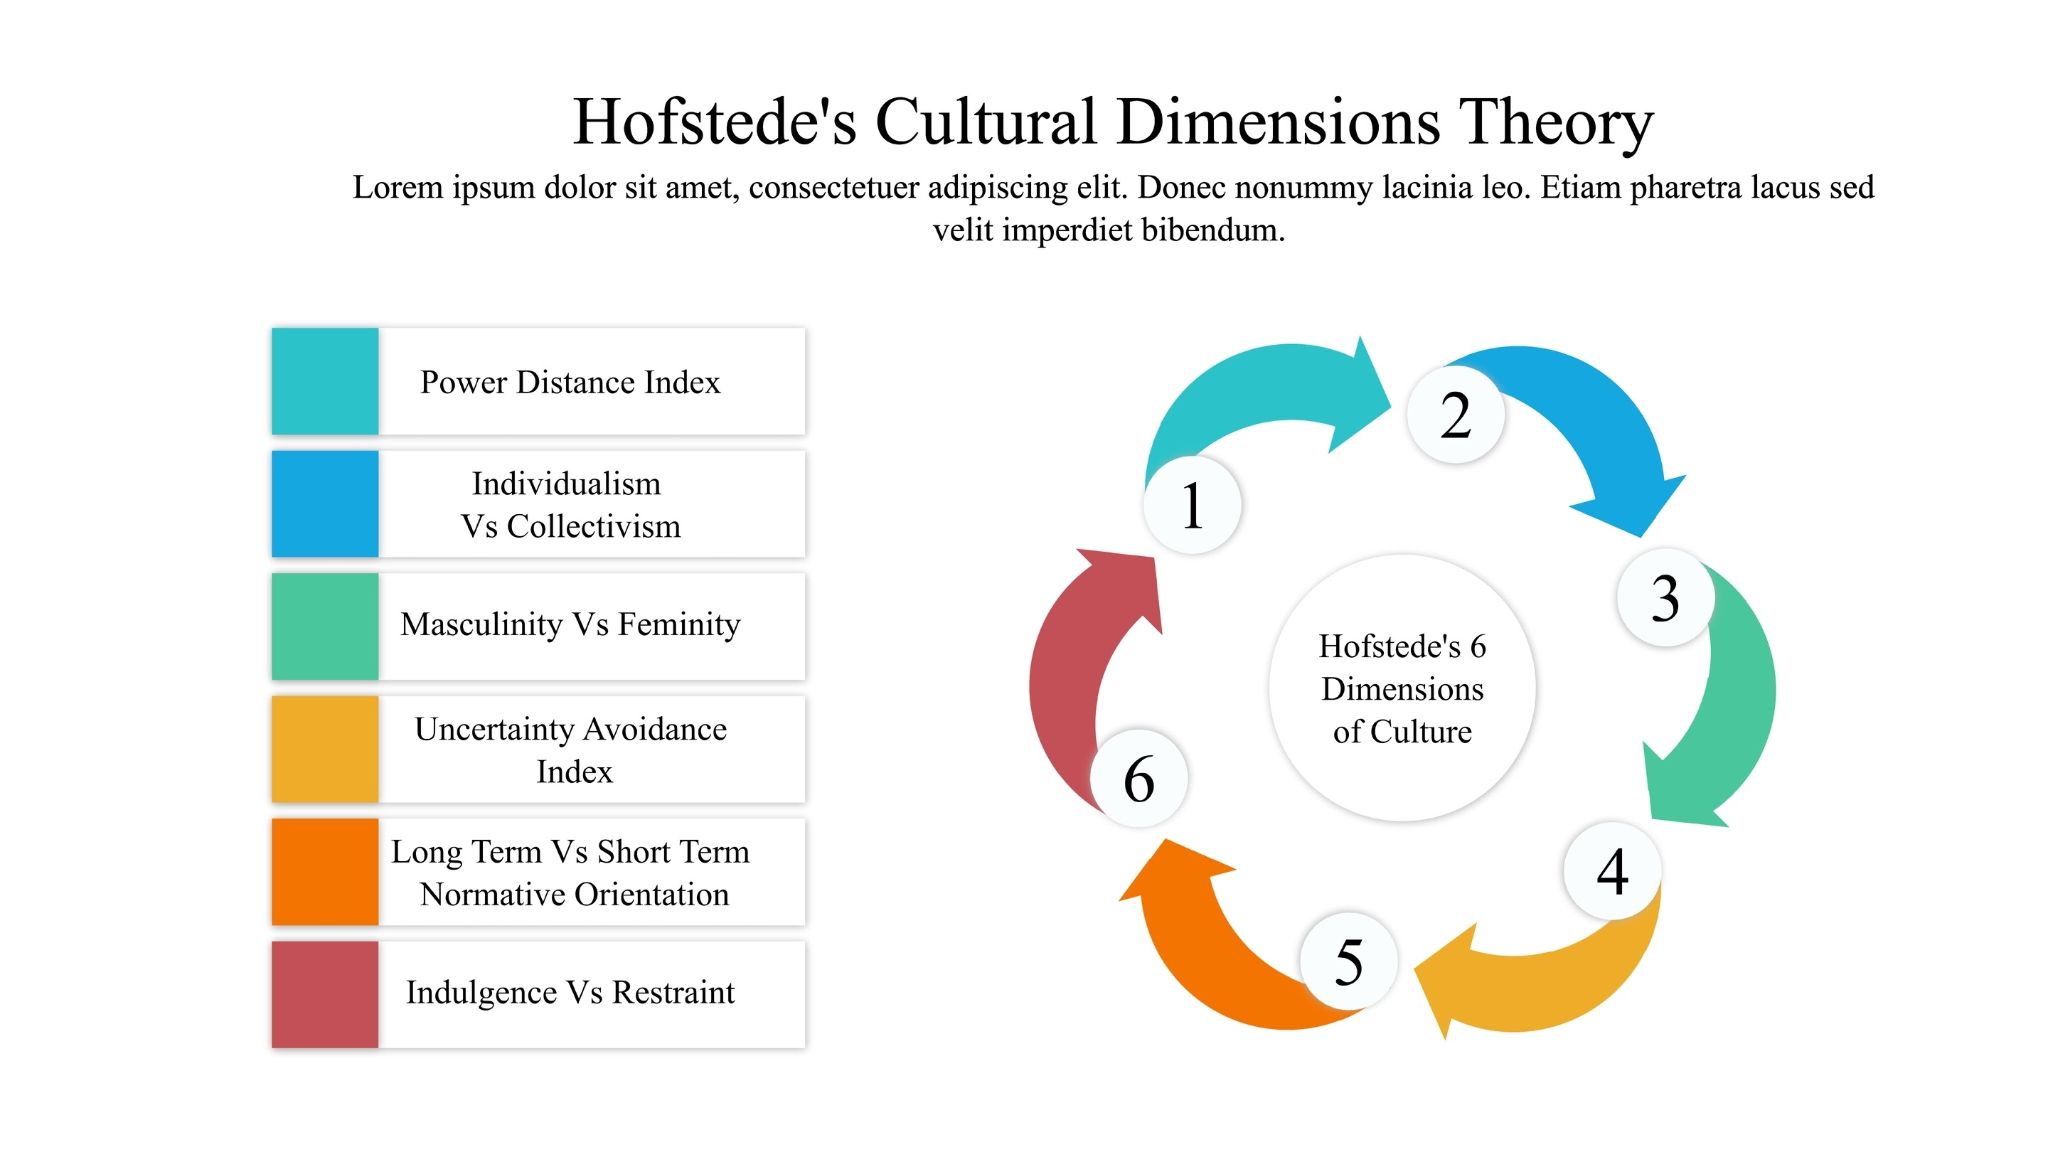
Three published frameworks form the analytical foundation. Geert Hofstede’s six-dimensional model provides quantified Power Distance (PDI), Uncertainty Avoidance (UAI), and Individualism (IDV) scores, used here as predictive indicators for sales methodology. Edward Hall’s context model (Hall, 1976) and Erin Meyer’s Culture Map (2014) complement the dimensional data with communication behavior analysis.
Power Distance (PDI) measures the acceptance of unequal authority distribution. In high-PDI markets — UAE (74) and Saudi Arabia (72) — purchasing authority concentrates at organizational peaks. Proposals reaching mid-level contacts do not advance. In low-PDI markets — Germany and the UK (both 35) — lateral champion engagement is structurally viable.
Uncertainty Avoidance (UAI) measures reliance on documented evidence and structured processes. High-UAI Germany (65) requires exhaustive compliance documentation before any vendor relationship is evaluated. Low-UAI markets — the US (46) and the UK (35) — prioritize vendor credibility and ROI arguments over formal documentation.
Individualism (IDV) describes whether decisions are made individually or through group consensus. The US (60) and UK (76) produce fast, champion-driven cycles. Lower-IDV markets such as the UAE (36) involve broader stakeholder alignment, where the reputational exposure of the individual sponsor is a live concern and artificial deadline pressure damages rather than accelerates closure.
In high-context GCC markets, a polite deflection may signal firm rejection; silence after a proposal is not ambiguity. Sales teams trained in low-context, direct-objection handling misinterpret these signals, extending cycles or permanently closing doors they believe are still open. Cultural Intelligence (CQ) research across 150 countries confirms that CQ is a stronger predictor of commercial effectiveness in cross-cultural settings than either general or emotional intelligence alone (Livermore, 2022).
A Seven-Market Practitioner Observation
Between 2017 and 2024, Andersen expanded from a 400-person regional company to approximately 4,000 staff, entering seven markets under my commercial leadership: Poland, Hungary, the UK, Germany, the USA, the UAE, and Saudi Arabia. The sales organization scaled from regional managers to 60 specialized technical consultants across ten time zones.
The core finding: deal-cycle deviation from the Central and Eastern Europe (CEE) baseline correlated consistently with the gap between the deployed methodology and the target market’s Hofstede PDI and UAI profile — not with product complexity, pricing structure, or pipeline volume. Each market that deviated from baseline required a full methodology rebuild. This sequence is divided into three phases:
Phase 1. CEE Baseline (Poland, Hungary, UK)
Observed cycles of 3–6 months. A relationship-first methodology, standard capability presentation, and direct commercial engagement produced results within expected parameters. The Hofstede profiles across these markets (PDI: 35–68; UAI: 35–93) permitted the baseline motion without structural modification.
Phase 2. Germany: Documentation-First Market
Observed cycle extended to 7–9 months. The Phase 1 methodology failed on initial deployment. German enterprise procurement (PDI: 35, UAI: 65) required a GDPR data handling architecture, supply chain due diligence under the LkSG Act, and independent technical audit references before any vendor was evaluated. Cold outreach produced response rates below 2% without ecosystem referrals. Before a first meeting, each buyer needed five to ten verified touchpoints. The mandatory rebuild placed compliance prequalification before any personal engagement — the reverse of the CEE model.
Phase 3. Gulf Markets (UAE, Saudi Arabia): Relationship-Gated Market
Observed cycles of 10–12 months in the UAE and 12–18 months in Saudi Arabia. The CEE methodology failed again, this time in reverse. Detailed technical proposals submitted to mid-level contacts produced no pipeline movement. In PDI-70 procurement environments, the formal proposal process is the administrative formalization of a decision already made at the C-suite level through a pre-established relationship. Saudi Arabia’s Vision 2030 technology program has committed over $20 billion to digital infrastructure, but access is conditional on executive-level pre-qualification. The rebuild: no proposal was submitted until a peer-level executive relationship existed, requiring 4–6 months of in-person engagement before any commercial discussion.
This three-phase sequence — relationship-first, documentation-first, relationship-gated — is the practitioner’s contribution to this article. PDI and UAI scores, read in combination before market entry, predict not only the likely cycle length but also the mechanism by which the current methodology will fail.
Table 1. Seven-Market Observation: Hofstede Profiles, Observed Deal Cycles, and Required Methodology Adjustments
| Market | PDI | UAI | IDV | Observed Cycle | Required Methodology Adjustment |
| Poland | 68 | 93 | 47 | 3–6 months | Relationship-first; standard motion effective |
| Hungary | 46 | 82 | 71 | 3–6 months | Relationship-first; standard motion effective |
| United Kingdom | 35 | 35 | 76 | 3–6 months | Champion-led; ROI argument; fast-cycle |
| Germany | 35 | 65 | 79 | 7–9 months | Documentation-first; compliance pre-qualification required |
| USA | 40 | 46 | 60 | 3–5 months | Brand familiarity prerequisite; direct ROI framing |
| UAE | 74 | 66 | 36 | 10–12 months | C-suite relationship before any proposal submitted |
| Saudi Arabia | 72 | 64 | 48 | 12–18 months | Government-adjacent procurement; executive pre-access essential |
The Commercial Architecture Diagnostic (CAD)
Hofstede and Hall provide a foundational baseline, but both were codified before distributed engineering teams, data sovereignty regulation, and digital procurement pipelines existed at their current scale. Based on Andersen’s expansion across seven markets over eight years, I developed the Commercial Architecture Diagnostic (CAD): six operational variables that translate classical cultural theory into actionable parameters for enterprise IT commercial teams.
1. Decision Architecture Node (DAN)
| Evolution of: | Power Distance (PDI) |
| The variable: | In enterprise IT, authority is no longer strictly vertical. It is a distributed web. The DAN identifies the “Hidden Veto” holder: the Lead Architect or CISO who can halt a deal the CEO has already blessed. |
| Operational insight: | In high-friction markets, the CAD protocol demands simultaneous technical validation at the node level and executive alignment to prevent late-stage pipeline collapse. |
2. Compliance-Velocity Gap (CVG)
| Evolution of: | Uncertainty Avoidance (UAI) |
| The variable: | The CVG measures how much localized regulatory density (e.g., SOC 2, HIPAA, GDPR) extends the sales cycle. |
| Operational insight: | During Andersen’s US financial-sector expansion, identifying a high CVG enabled the front-loading of legal and security audits, reducing time-to-contract by approximately 30%. |
3. Asynchronous Communication Yield (ACY)
| Evolution of: | High/Low Context (Hall) |
| The variable: | The ACY measures a client’s capacity to build trust through asynchronous tools (Jira, Slack, GitHub) versus requiring synchronous in-person rapport. |
| Operational insight: | Markets with low ACY require a higher ratio of on-site technical consultants to maintain perceived project momentum. |
4. Algorithmic Trust Calibration (ATC)
| Evolution of: | Collectivism vs. Individualism (IDV) |
| The variable: | The ATC measures whether a buyer prioritizes relationship-based loyalty (affective) or performance-based metrics like code quality, uptime, and security benchmarks (cognitive). |
| Operational insight: | In GCC markets, our analysis showed that while relationships facilitate initial engagement, deal closure occurs only when the ATC meets a specific, localized proof-of-concept threshold. |
5. Digital Sovereignty Distance (DSD)
| Evolution of: | CAGE Framework (Ghemawat) |
| The variable: | Data geography now frequently carries more commercial weight than physical geography. The DSD measures friction from national data residency laws and IP protections. |
| Operational insight: | Successful US expansion required a zero-distance DSD strategy: a fully local commercial and legal infrastructure to satisfy the regulatory proximity that American engineering clients demand. |
6. Vendor Subordination Index (VSI)
| Evolution of: | A proprietary variable |
| The variable: | The VSI measures whether a market classifies the IT partner as staff augmentation (labor) or a strategic co-engineer (intellectual partner). This governs pricing and positioning strategy. |
| Operational insight: | High-VSI markets (the US and UK) reward peer-to-peer engineering dialogue. Consequently, Andersen instituted a mandatory technical certification program for the entire commercial team. |
Table 2. Commercial Architecture Diagnostic (CAD): Seven-Market Application
| Market | DAN | CVG | ACY | ATC | DSD | VSI |
| USA | Moderate (Architect-heavy) | Moderate (Sector-dep.) | Low (Async) | Cognitive (Metrics/ROI) | High (Strict IP) | High (Strategic Partner) |
| Germany | High (Committee-led) | High (Heavy Compliance) | Moderate (Structured) | Cognitive (Technical Audit) | Extreme (GDPR/Residency) | High (Engineering Peer) |
| UAE | Extreme (Exec. Veto) | Low (Agile/Swift) | High (In-person) | Affective (Relationship) | High (Sovereign Data) | Moderate (Consultant) |
| UK | Low (Ind. Champion) | Low (Commercial Speed) | Low (Outcome-based) | Mixed (Logic + Rapport) | Moderate (Aligned) | High (Strategic) |
| Saudi Arabia | Extreme (Centralized) | Moderate (Evolving) | High (High-touch) | Affective (Protocol-first) | Extreme (Nat. Security) | Moderate (Exec. lead) |
| Poland | Moderate (Technical) | Low (Standard EU) | Low (Dev-heavy) | Cognitive (Code Quality) | Moderate (GDPR) | Rising (Staff Aug→R&D) |
| Hungary | Moderate (Technical) | Low (Standard EU) | Moderate (Collaborative) | Cognitive (PoC-focused) | Moderate (EU-aligned) | High (Tech Innovator) |
Three operational conclusions follow from the CAD data. High-CVG markets (Germany) require compliance and security specialists deployed before salespeople — the technical audit clears the commercial path. C-suite visibility is essential before issuing an RFP in affective ATC markets (UAE, Saudi Arabia), as deals close based on social capital accumulated months before any formal proposal. High-VSI markets (US, UK) allow value-based pricing because buyers seek architectural excellence over lowest-cost delivery, but only from vendors whose commercial teams can sustain a technical peer conversation.
Conclusion
The evidence in this article — drawn from peer-reviewed research, verified market benchmarks, and seven sequential commercial entries over eight years — supports one operational conclusion: cultural distance is a diagnosable commercial variable, not a background condition.
The three-phase sequence shows that selling the same solution requires a structurally different operational model in Germany than in Poland and another one in the UAE. These are methodology rebuilds driven by dimensional profiles that are publicly documented, quantitatively stable, and knowable before the first sales call.
The CAD framework extends this analysis into the digital procurement environment, converting cultural theory into six operational parameters that determine commercial positioning, proposal sequencing, and pricing strategy.
For commercial leaders, the implication is direct: cultural intelligence must be institutionalized within market entry planning. Organizations that conduct this analysis before committing to a go-to-market model will reduce time-to-first-revenue, preserve relationships that an unadapted methodology would damage, and build sales engines capable of international scale. Those that do not will continue attributing underperformance to product gaps or market timing when the actual cause was predictable and preventable.
References:
- Christensen, C. M., Alton, R., Rising, C., & Waldeck, A. (2011). The New M&A Playbook. Harvard Business Review. https://hbr.org/2011/03/the-big-idea-the-new-ma-playbook
- Ghemawat, P. (2001). Distance Still Matters: The Hard Reality of Global Expansion. Harvard Business Review. https://faculty.washington.edu/pathaksd/BBUS549/Required%20Readings/Distance%20Still%20Matters.pdf
- Griffith, D. A., Dean, T., & Hoppner, J. J. (2021). Choices and Consequences: Recommendations for an Improved Understanding of Cultural Distance in International Marketing Research. Journal of International Marketing. https://doi.org/10.1108/02651331311298555
- Hall, E. T. (1976). Beyond Culture. Anchor Press/Doubleday.
- Hofstede, G. (1980). Culture’s Consequences: International Differences in Work-Related Values. Sage Publications.
- Hofstede, G. (2001). Culture’s Consequences: Comparing Values, Behaviors, Institutions, and Organizations Across Nations (2nd ed.). Sage Publications.
- Livermore, D. (2022). Leading with Cultural Intelligence: The Real Secret to Success (3rd ed.). AMACOM.
- Meyer, E. (2014). The Culture Map: Breaking Through the Invisible Boundaries of Global Business. PublicAffairs.
- The Culture Factor Group. (2026). Country Comparison Tool: Dimensional Data for National Commercial Behavior. https://www.theculturefactor.com/country-comparison-tool
#CAD #Framework #Market #Entry #Success