
Phimprapha Kitaiamphaisan/iStock via Getty Images
Global large cap indices finished with modest gains in the September quarter, as the S&P 500, MSCI EAFE (Local/USD), and MSCI World advanced by 2.30%, 0.62%/0.81%, and 1.88%, respectively. The AI momentum trade had a steep sell-off at the start of the period, before rebounding significantly. U.S. small cap stocks declined in the quarter, with the Russell 2000 falling by 7.23%. After outperforming during the first half of the year, small caps came under increasing pressure as rising interest rates and energy prices weighed on sentiment.
The interest rate backdrop shifted materially in the period, with the Federal Reserve raising rates by 25 basis points in September to 3.75-4.00%, its first hike since 2023. The 10-year Treasury yield climbed to over 5%, its highest level since 2007, compounded by a spike in oil prices and a widening federal deficit. Small caps were disproportionately exposed to this shift, with over twice the leverage of large caps and a much higher share of floating-rate debt (32% for the Russell 2000 vs. 6% for the S&P 500), according to Goldman Sachs. This quarter’s small cap divergence looks less like an AI story and more like a financing story.
Markets Emboldened
Over the past three years, global stock markets have compounded well above long-term averages. The Russell 2000, S&P 500, MSCI EAFE (Local/USD), and MSCI World have gained around 17.72%, 22.89%, 16.55%/18.40%, and 21.40%, respectively, on an annual
basis. These extraordinary returns are unlikely to be sustained, particularly when a large subset of the market remains at high valuation levels. Moreover, risk appetite, as measured by the Leuthold Group courage/fear sentiment indicators (shown on the bottom of the page), continues to rise, reaching heights only seen twice previously in the last 35 years. Notably, both prior readings preceded significant bear markets in 2000 (Tech Bubble) and 2008 (Great Financial Crisis).
Leuthold Group tallied historical S&P 500 price changes in the table below, noting that greater levels of fear typically translate into higher forward returns, while greater levels of courage (i.e., greed) lead to lower forward returns. The 6-month spread of 20%+ between high fear (+17.3%) and high courage (-3.1%) is telling. Their conclusion was summed up as follows: “They [fear and courage indicators] are contrarian measures that suggest the emotions of the crowd become too extended on either end, creating initial conditions that lead to sizable return deviations in the opposite direction going forward.” In plain language, when the crowd gets too scared or too greedy, betting against them has historically paid off. This is precisely the kind of dislocation we look to exploit.
Courage/Fear Investor Ratio
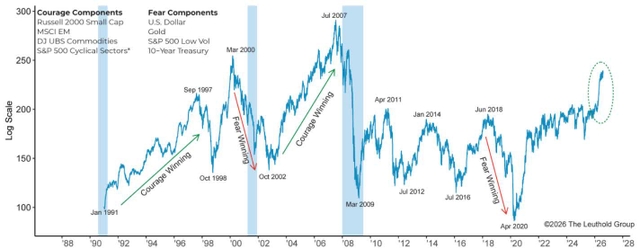
We have highlighted the relationship between fear, greed, and investor behavior in several prior letters. Traditionally, some of the market’s best long-term opportunities have come during periods of extreme fear and/or low valuations. Today, AI enthusiasm has led to the opposite conditions, absent a few isolated pockets of the market (i.e., “AI At Risk”). While we view the current backdrop as a time for increased prudence and vigilance, there are always compelling values hiding in plain sight, several of which we outline at the end of the letter.
The Only Game in Town
AI is a genuinely transformative technology. We are impressed by its capabilities, pace of innovation, and productivity potential, but the risks are real too, ranging from labor market disruption to more existential questions about control. Where this lands over the long term is uncertain. What’s not uncertain is the here and now: the technology is advancing at full speed, and its impact on the economy and stock market is unmistakable.
Spending on AI infrastructure has grown at a breakneck pace. Mega-cap hyperscalers are set to spend around $800 billion on capex in 2026 (+94% vs. 2025), and over $1 trillion annually from 2027 and beyond. That spending flows through the entire AI value chain, including semiconductors, technology hardware, industrial, and utility companies, to name a few. As stock markets soar, capital market activity and consumer net worth also increase.
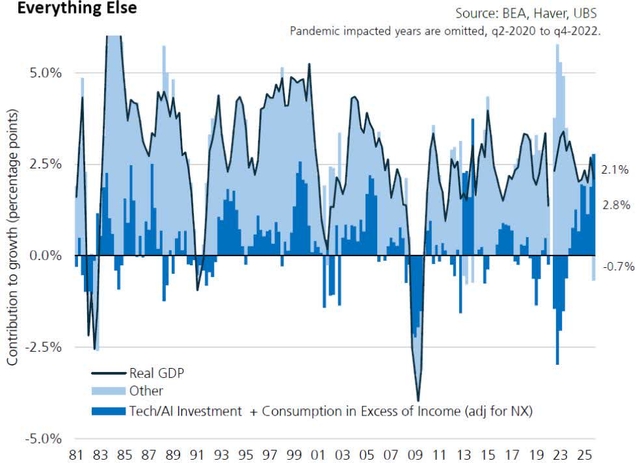
UBS has attempted to quantify the impact of AI on U.S. economic growth. To cut to the chase: they estimate that over 100% of reported U.S. GDP growth over the last 4 quarters was driven by AI, with the rest of the economy contracting. Per UBS: “We estimate that [AI impact] by first separating AI-linked investment and production from the rest of the economy. AI-related investment categories have grown roughly 30% in the last 12 months, and other investment components have not grown at all, and so despite having only a 2.5% weight in GDP, that is driving all of the investment contribution. Then, on the consumption side, we assume real consumption growth exceeding real disposable income growth reflects the contribution of wealth effects to GDP (mostly equity gains from AI optimism). And when you add up those two contributions, investment and consumption funded by wealth, there is nothing left for ‘other’ (i.e. government, spending from income and non-tech investment). In fact, ‘other’ contracted by 0.7% YoY.” This paints a darker picture of the underlying U.S. economy than headline numbers suggest, leaving consumers vulnerable should the primary engine falter.
The S&P 500 earnings picture tells a similar story. Consensus operating EPS growth for the S&P 500 in 2026 is expected to be ~28%. Paper gains on AI investments will help push the total growth rate to ~33%. For historical comparison, S&P 500 4-quarter EPS growth has averaged ~7% over the past 30 years, according to Goldman Sachs. Current growth rates (roughly 4 times normal levels) were only reached previously during post-recession recoveries in 2010 and 2021. Goldman Sachs expects 2/3 of the 2026 growth (excluding AI investment gains) will come from AI Infrastructure (~50%) and Hyperscalers (~14%). NVIDIA (NVDA) and Micron (MU) alone are projected to account for over a third of the total S&P 500 growth this year! The concentration extends to the index itself: AI-linked names now make up roughly 45% of the S&P 500’s total market capitalization, the most concentrated in modern history. The sustainability of these remarkable growth rates remains hotly debated.
AI at Risk
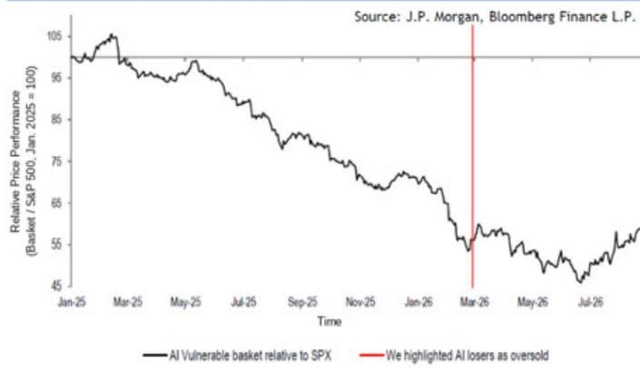
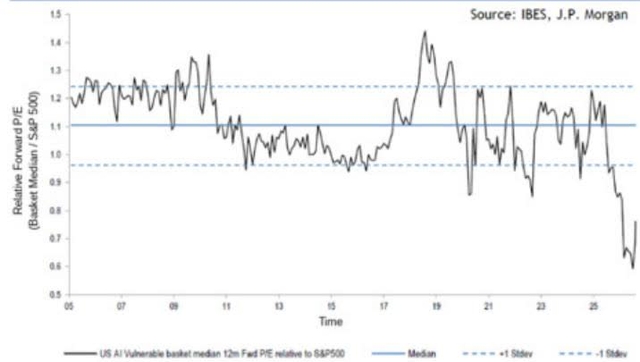
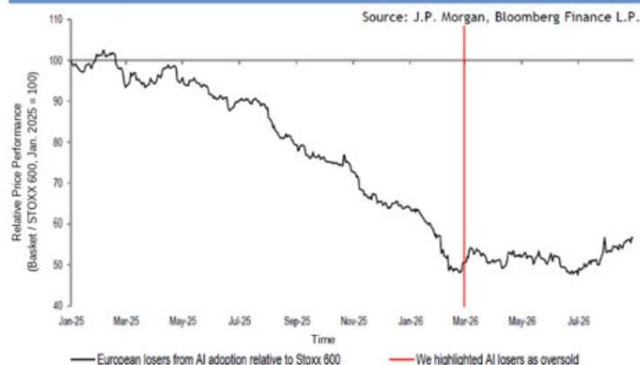
As we outlined in last quarter’s letter, there has been a sharp contrast between how investors are treating companies currently benefiting from AI spending versus those perceived to be susceptible to AI disruption. For AI capex beneficiaries, the sky is the limit; valuation in many cases has become an afterthought. Conversely, if a business model is perceived to carry AI risk, watch out below; stock prices and valuations have gone into a free fall. We have found the latter to be a fertile hunting ground, but one that requires careful analysis and discernment. While many investors are shooting first and asking questions later, we are asking questions now and looking to capitalize on select opportunities where we believe the idiosyncratic situation is misunderstood and the sell-off unjustified. The charts above give a snapshot of the AI At Risk category in the U.S. Relative stock performance is depicted on the left, with a 2-3 standard deviation valuation discount to history on the right.
U.S. Growth Contribution from AI (Investment & Consumption) versus Everything Else
US AI at risk basket relative to S&P 500
US AI at risk basket 12m Fwd P/E relative
This is not just a U.S. dynamic – the same phenomenon has taken place across developed international markets, as the equivalent charts for Europe below illustrate.
European AI at risk basket relative to Stoxx 600
European AI at risk basket 12m Fwd P/E relative
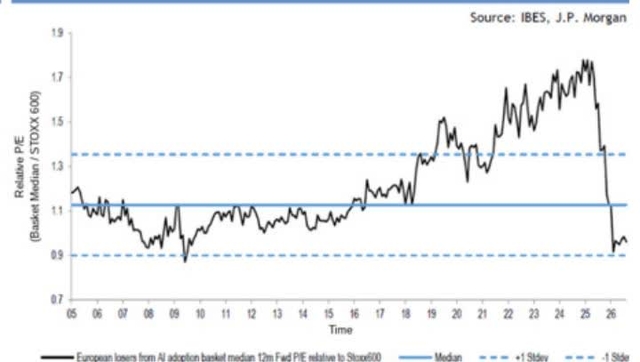
Much of this repricing has been a blunt instrument, punishing resilient businesses alongside those truly exposed to AI disruption. Our process has not changed amid this dispersion; we are looking for high-quality, well-financed franchises trading at a discount to intrinsic value. This year’s AI-driven volatility has simply widened the opportunity set. Our portfolios trade at a significant discount to their respective benchmarks on a variety of valuation measures. We think this gap will close over time as the market moves past a blanket AI narrative and reprices these businesses on their own merits. The following three holdings illustrate where we see AI mispricing today. In each case, we have built the position into recent weakness.
Jack Henry & Associates Inc. (JKHY) – Small Cap
Jack Henry is an enterprise software business serving local commercial banks and credit unions. The company provides core banking software, the back-office technology stack that allows a financial institution to open customer accounts, take deposits, and process transactions. The product’s mission-critical nature is difficult to overstate – without this core, a bank cannot perform its most basic functions. Switching costs define Jack Henry’s competitive advantage, as its risk-averse customers in the highly regulated financial services industry are loath to rip-and-replace essential business infrastructure. Jack Henry has differentiated itself through a highly integrated suite of products and customer service that simplifies operations for the smaller, less-resourced organizations it serves. While Jack Henry doesn’t have the R&D budget available to its much larger competitors, management’s singular focus on this market opportunity has allowed it to thrive. This is evident in the most recent Core Platform Survey conducted by the American Bankers Association – customers rank Jack Henry well ahead of the competition. This has helped support a decades-long trend of market share gains. Shares have de-rated this year as investors have priced in the risk of disruption from AI. The market has largely been undiscerning in its treatment of software businesses, but we think there’s value in forming a more nuanced view. Banking software is heavily regulated, cybersecurity is paramount, and local banks are in the business of serving their local community, not building technology. We think it’s more likely that Jack Henry emerges as a beneficiary of AI-driven efficiencies, rather than a casualty of technological disruption. Employees are operating more efficiently, new capabilities are shipping faster, and the company is embedding AI-enabled functionality into its offering. Jack Henry is leaning into change, and we’re expecting financial performance to accelerate, not decelerate, over the coming years. Given the mispriced AI risk attached to Jack Henry shares, we were able to buy at a valuation discount to the broader market – an unusual entry point for a business of this quality.
CDW Corp. (CDW) – Large Cap/Global
CDW is a leading multi-brand provider of technology products, services, and solutions, serving over 250,000 commercial, government, education, and healthcare customers across the U.S., UK, and Canada. The company sells through a workforce of roughly 10,900 customer-facing employees, including sellers, highly skilled specialists, and engineers. Scale is a key competitive advantage, as access to more than 100,000 products from over 1,000 vendor brands allows CDW to embed itself across a customer’s IT procurement, integration, financing, and lifecycle management needs in a way that smaller resellers simply can’t match. That breadth, paired with deep vendor certifications, has produced a sticky, relationship-driven franchise with a long history of share gains. Results have been held back in recent years by weak corporate IT spending, and the market has grown increasingly concerned about CDW’s role in delivering AI solutions to customers, pressuring both the share price and valuation. We believe that the air pocket in IT spending is temporary, and that CDW will in fact play a vital role in helping customers implement AI. Beyond that, we see AI as a net positive for demand over time: the buildout of AI-ready infrastructure, the modernization of legacy data environments, and the general increase in IT activity required to support these initiatives should all flow through as incremental opportunity for CDW. The pace of change and complexity across the IT landscape has increased dramatically, and we think this only deepens customer reliance on a trusted third-party expert to help them navigate it – positioning CDW well to capture this demand as customers work through it. The market, however, appears to be taking the opposite view. We see this as a divergence between our outlook and the market’s and believe that gap is precisely what creates an attractive entry point today. If our view plays out, CDW should be able to deliver accelerating EPS growth while being re-rated– a combination that, together with a shareholder-friendly capital return framework, sets up a very attractive investment opportunity.
RELX PLC (RELX) (REL-GB) – International
RELX is a business services organization comprising four distinct business units – Risk, Legal, STM (Scientific, Technical, and Medical), and Exhibitions, though the first three drive the bulk of the investment case today. The commonality between these organizations is deep industry expertise and advantages built through the development, maintenance, and monetization of valuable data and content. For example, the Risk business provides customer risk analysis that aids in effective underwriting in the domestic auto insurance industry. Risk marries a contributory database sourced from industry with proprietary data gathered by RELX and licensed datasets purchased from others to create a more comprehensive view of a prospective customer than any single insurer could develop alone. At Legal, RELX has developed a deep archive of case law, legal precedent, and statutes built over decades to create one of two authoritative legal research repositories in the U.S. RELX was an early mover on AI in this vertical and has released product features that accelerate the legal research process and support the attorney workflow. This is translating into attractive incremental economics for RELX today – what was once a reliable 1-2% grower is now compounding revenue at a high-single-digit clip. STM publishes academic journals and develops related decision support tools for researchers. As low-quality AI-created content proliferates, STM’s position as the trusted gatekeeper to prestigious industry journals will likely become more, not less, important. Like Legal, STM is seeing faster growth today as article volumes rise and management leans into AI-enabled capability in the research support products that sit atop one of the largest journal archives in the world. Investors are ignoring the growth acceleration seen across RELX’s businesses and instead over-emphasizing the still-theoretical risk to RELX’s data assets posed by AI-native entrants. We view RELX’s incumbent market position as difficult to displace, and we’re encouraged by management’s adoption of AI tools within the closed loop product suite. RELX has navigated technological change in the past, and we think the odds are good that management will continue to position the business for success. We expect the market to eventually recognize that acceleration and re-rate the shares accordingly, closing a valuation gap we do not think reflects the quality or durability of the underlying business.
Thank you for your continued support of Fiduciary Management, Inc.
References
- Geometric average of S&P 500 Financials, Industrials, Materials, Consumer Discretionary
Original Post
Editor’s Note: The summary bullets for this article were chosen by Seeking Alpha editors.
#Fiduciary #Management #Investment #Strategy #Outlook